Experts have been rolling their eyes at the federal poverty guidelines for years. The numbers are unrealistic; the formula they come from is outdated. But government is government.
So, despite official calls for change since the Nixon administration, the guidelines remain based on mid-20th-century spending patterns, and for the most part, they don’t even adjust for location.
In 2011, the Silver Century Foundation (SCF) jumped into the fight to change things. By funding a strategic study on older people in its home state, New Jersey, the foundation ended up helping to educate policymakers, increase the impact of safety-net programs and ultimately change state law.
Today, New Jersey is considered a leader in accurately recognizing poverty among older citizens. But getting here took the persistent work of private nonprofits that were determined to help older people who were in need live independently, with dignity. First step: find them.
Stepping over the Poverty Line
Officially, in 2010, about 8 percent of New Jersey’s citizens 65 and older were living in poverty. But “poverty” for a single-person household meant an income of only $10,830 per year or less. For a two-person household, it was $14,570.
These numbers came from the federal poverty guidelines, which are based on this formula: three times the cost of a minimal food plan in 1963, adjusted for modern pricing.
That made sense in the mid-20th century when, it was estimated, people spent a third of their money on food. But today, nourishment eats up more like 13 percent of the budget. (Housing and transportation take bigger chunks.) So the guidelines substantially underestimate the amount of money people need to stay afloat.
Yet the decision-makers for many federal, state and private safety-net programs—such as ones that help pay for electricity, medications and food—use the poverty guidelines to determine need and set eligibility levels. (For example, program participants may have to have an income below, say, 135 or 150 percent of the poverty line.) And in the contiguous United States, the guidelines don’t even take cost of living into account. Manhattan has the same poverty line as small-town Mississippi.
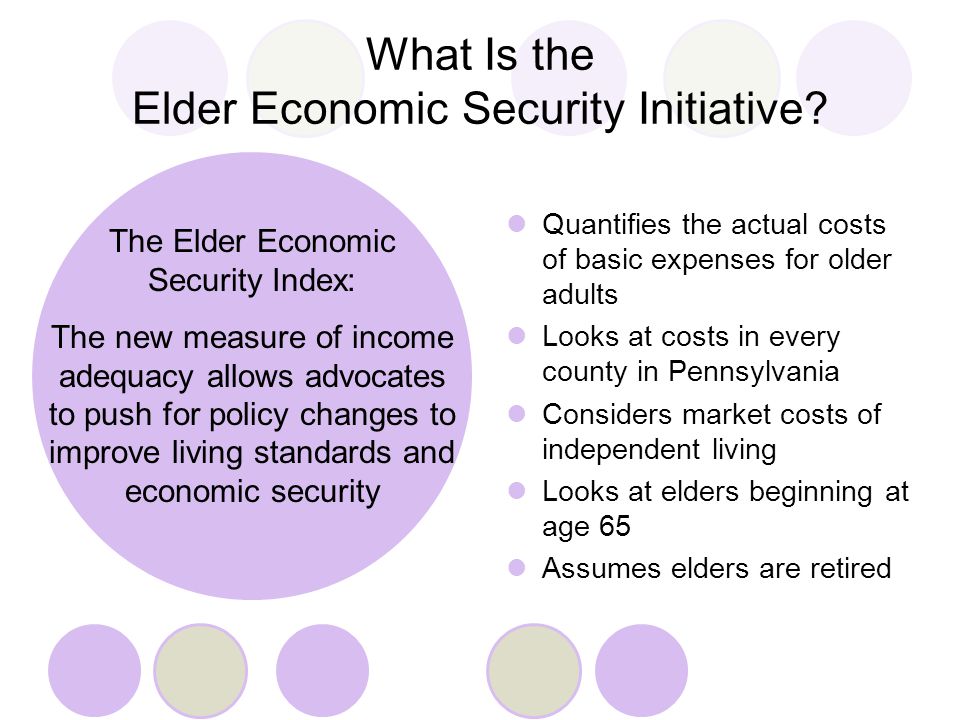
So various organizations have developed alternate guidelines. One in particular quickly shot to the forefront: the Elder Economic Security Standard Index—Elder Index for short. According to it, more like 43 percent of older New Jerseyans lived in poverty in 2010. We know this—and much more—because of a trailblazing study.
The Age Difference
Most alternate poverty guidelines don’t sufficiently adjust for a key factor—age—even though spending patterns change with it. Health care expenses tend to increase, while assets decrease.
So in the mid-2000s, researchers at the University of Massachusetts Boston developed the Elder Index in partnership with the nonprofit Wider Opportunities for Women (now inoperative).
The Index’s focus was on aging in place: how much money, minimum, did people 65 and older need to live independently, in their own homes?
“There were other policy research and advocacy organizations that were looking at the real cost of living for families,” said Melissa Chalker, deputy director for the New Jersey Foundation for Aging (NJFA). “But nobody was saying, ‘It’s different for older adults.’”
Now maintained by the National Council on Aging and the Gerontology Institute at the University of Massachusetts Boston, the Elder Index takes into account the cost of not only food but housing, health care, transportation and other essentials to living in place with dignity. There is economic security data for each state as a whole, as well as every county in the nation. And it varies according to household size (one or two people) and type (rental, owned with a mortgage, owned without a mortgage).
She believed the study was worthwhile—but she felt the government should pay for it.
“There had never been a tool developed like that previously,” said Grace Egan, executive director of the New Jersey Foundation for Aging. Yet she wanted more.
In 2009, NJFA—under the guidance of Wider Opportunities for Women—published one of the first state-based studies using the Elder Index. Its usefulness was limited, though. It showed how much income older New Jerseyans needed to live on but didn’t specify how many fell under the threshold or who they were. How many were women? Men? What were their ethnicities? Did findings differ by age?
So Egan approached Katherine Klotzburger, PhD, president of the Silver Century Foundation, with an idea: would SCF fund a more in-depth Elder Index study that delved into demographics?
“This is really a gong ringer for me,” said Klotzburger about poverty among older adults. It’s an issue she feels passionately about and works to fight. So she believed the study was worthwhile—but she felt the government should pay for it.
When it became apparent that that wasn’t an option, she decided to move forward with the grant, hoping the study would at least help the state better understand the importance of robust safety-net programs—and understand who, exactly, needed them.
So, funded by the SCF, the demographic study was conducted by the Legal Services of New Jersey Poverty Research Institute under the guidance of NJFA, which then published the results in 2012.
Surprising Results
The study, based on data from 2010, found that more than one-third of older New Jerseyans had enough income to put them over the federal poverty line but not enough to cover basic, essential, living expenses. (The Index ranged from $25,320 per year, for a homeowner living alone with no mortgage, to $48,204, for a two-person household with a mortgage. Altogether, 252,470 people 65 and older—42.6 percent—lived below that range.)
 Further, the study revealed specific demographics. People living alone, women, renters and people 75 and older were more likely than their counterparts to live below the Index. Among people living alone, about 84 percent of Latinos, 72 percent of blacks, 56 percent of Asians and 55 percent of whites fell below the Index. And those are just the state averages. The data was further broken down by county.
The 2012 study “allowed us to provide information to the state, to the local policymakers, to local planners, that wasn’t before available to them,” Egan said. “It also gave us the opportunity to work with antipoverty programs, antihunger programs and affordable housing programs” to try to increase access to services.
And, when presenting the study to decision-makers, Egan was able to educate them about what life was like for many older people. “We wanted to highlight the fact that seniors did have a different set of conditions that might make them more vulnerable,” Egan said. For example, per the study, one in four older New Jerseyans relied solely on Social Security. In 2010, the average monthly draw for a retiree was $1,176 nationally—less than $15,000 a year. Living on a fixed income like this can make sudden financial hardship, such as the cost of moving from a flooded house or being financially exploited, especially devastating.
Egan has also been able to correct misconceptions. Once, in a meeting with gubernatorial candidates about the Index, someone on a policy team asked why a person over 65 would have a second mortgage. “And I was, like, they had a second mortgage because their furnace blew up, they needed a roof, they put their kids through college,” Egan said. “There are so many reasons why somebody after 65 would still have a mortgage.” At other times, she’s confronted the common belief that health care is free for older people.
Policy Impacts
The goal of doing the study wasn’t just to educate. It was to prompt meaningful change.
“The important thing is to make sure that we’re connecting people with services, not just describing the plight,” Egan said. “We didn’t do the study just to look at the numbers.”
And change has come.
For one thing, safety-net programs in New Jersey used to be disconnected. For example, people accepted into the pharmaceutical assistance program might not be told they may also qualify for the Supplemental Nutrition Assistance Program (SNAP). The Elder Index data helped leaders of such programs realize that many of their target enrollees overlapped—so perhaps they could reach more people by working together.
In 2016, the state’s Division of Aging Services launched a universal application form that screens people for eight programs at once. In addition, compared to 10 years ago, enrollment in SNAP has doubled, Egan said. “In some respects, what the study did was highlight and hopefully target outreach from county programs a little bit better.”
As for Klotzburger’s wish: the state did see the benefits of the study—so much so that in 2015 government funding for future Elder Index studies was signed into law.
“The legislators in New Jersey thought the study was a significant tool and that it should be incorporated into the state planning process,” Egan said.
The next step is to increase affordable housing in New Jersey That would be the biggest help for many people with incomes below the Elder Index.
The law also requires the Department of Human Services to use future studies’ findings in the planning, coordination and delivery of safety-net programs.
“To my knowledge, New Jersey is the only state to incorporate language that is this strong into law,” Jan Mutchler, PhD, said via email. Mutchler is the director of the Center for Social and Demographic Research on Aging at the University of Massachusetts Boston, which publishes reports on the national Elder Index. “New Jersey is a leader with respect to using the Elder Index.”
The state has funded two studies so far, both published in 2017.
“I think that because of the requirements of the New Jersey legislation, and the persistence of advocates like the New Jersey Foundation for Aging, the frequency of developing and issuing these types of materials has been better than in most other states and locations,” Mutchler said.
But Egan isn’t finished yet. The next step is to increase affordable housing in New Jersey, she said, explaining that this would be the biggest help for many people with incomes below the Elder Index.
“And so we have continued to use the study—the Elder Index and its data—to continue to push. We are working with housing advocates and managed-care providers to help them understand the meaningful role of affordable housing—and how we can work with developers to continue to expand the housing options.
Basic Elder Index data for counties nationwide is available through this interactive tool.
“We would not have had the ability to do the demographic profile for the 2012 report without additional dollars. And the Silver Century Foundation provided those dollars. I think that’s an important piece to recognize,” Egan said. “It really made it such a better tool to illustrate how seniors are struggling in New Jersey. Not only were we able to say who these people were but how many. And for some people, it gave them a better sense that [poverty] was affecting a greater number than they had ever imagined.”

Leigh Ann Hubbard is a professional freelance journalist who specializes in health, aging, the American South and Alaska. Prior to her full-time freelance career, Leigh Ann worked at CNN and served as managing editor for a national health magazine. A proud aunt, Leigh Ann splits her time between Mississippi and Alaska.


